Add Timing
The Add Timing tool injects gradient-adjusted timestamps into track points based on a target average speed. This is useful for route or course files that have no time data, enabling speed and pace charts, and providing realistic duration estimates.
How It Works
The tool distributes timestamps across track points based on the effort required for each segment. Segments on steep climbs take proportionally more time than flat or downhill segments, producing a realistic time profile rather than simply spacing points evenly.
The algorithm works in three steps:
- Calculate the distance and gradient for each segment between adjacent track points
- Apply a speed multiplier based on the gradient and activity type to determine the "effort" for each segment
- Distribute the total time (from distance and average speed) across points proportionally by effort
Activity Types
| Activity Type | Speed Model | Default Speed |
|---|---|---|
| Cycling | Exponential decay on climbs (harder = slower). Capped 40% speed gain on descents. Best for road and gravel cycling. | 20 km/h |
| Walking | Tobler's hiking function — optimal pace on slight downhill (-5% grade), rapid slowdown on steep terrain in both directions. Best for hiking, walking, and trail running. | 5 km/h |
Controls
Activity Type
Toggle between Cycling and Walking. Changing the activity type also resets the average speed to the default for that type and recalculates the gradient model.
Average Speed
Your target average speed in km/h. Use the +/- buttons or type a value directly. Speed presets are provided for common activities:
- Walk 4, Walk 5 — casual to brisk walking
- Hike 6 — moderate hiking pace
- Run 10 — easy running pace
- Ride 20, Ride 25, Ride 30 — recreational to sport cycling
The speed you enter is the overall average — the tool automatically adjusts individual segment speeds for gradient, so some sections will be faster and some slower.
Start Time
The timestamp assigned to the first track point. Defaults to the current date and time. Change this if you want the timestamps to reflect a specific event time.
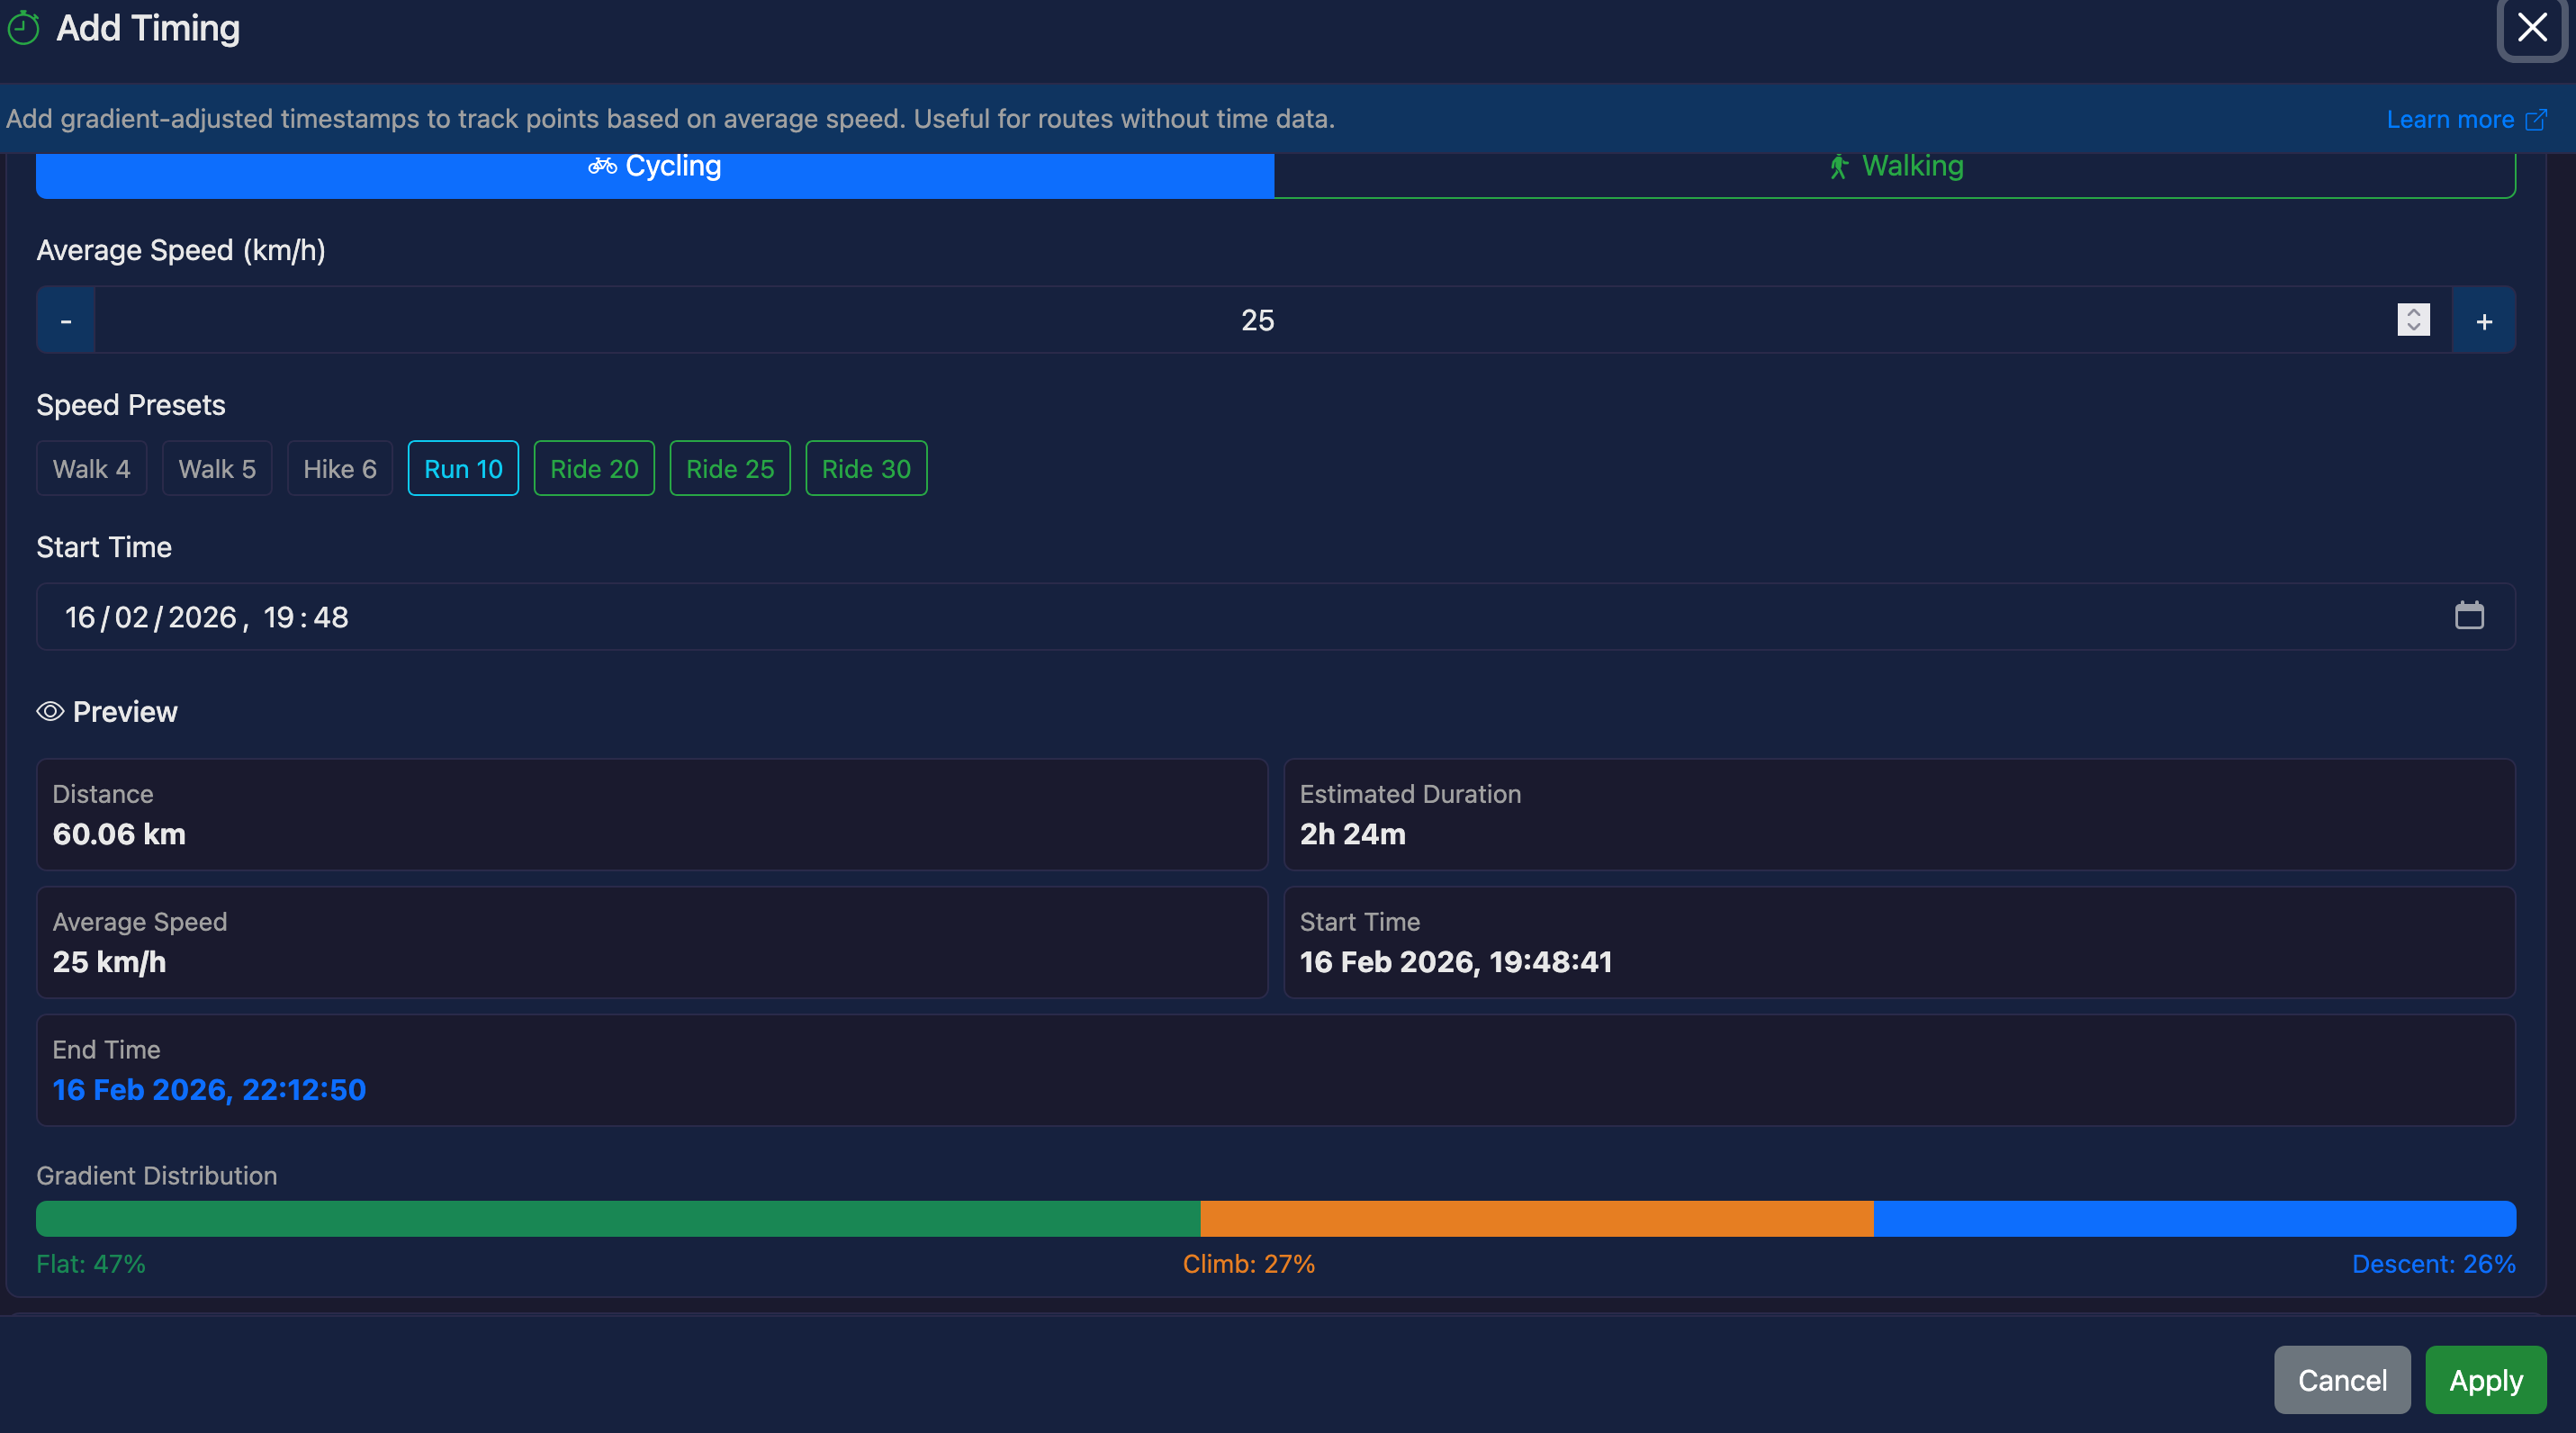
Preview
The preview section updates live as you adjust settings:
- Distance — total route distance
- Estimated Duration — how long the route will take at your chosen speed
- Average Speed — your selected speed
- Start / End Time — when the activity will start and finish
- Gradient Distribution — a colour-coded bar showing the proportion of the route that is flat (green), climbing (orange), and descending (blue)
Applying the Tool
Click Apply to add timestamps to all track points. The modified data replaces the current track, and you can:
- View the timestamps in View Raw — look for the
elements on each track point - See speed and pace in the chart preview (switch to speed/pace axis)
- Use Undo to revert the changes if needed
- Export with timestamps to GPX or FIT format
Gradient Model
Gradients are calculated from elevation change and distance between adjacent track points. Values are clamped to a range of +/-30% to avoid extreme values caused by GPS noise.
| Gradient | Cycling Multiplier | Effect |
|---|---|---|
| -10% | 1.40x (capped) | 40% faster than flat |
| -5% | 1.25x | 25% faster |
| 0% (flat) | 1.00x | Base speed |
| 5% | 0.78x | 22% slower |
| 10% | 0.61x | 39% slower |
| 15% | 0.47x | 53% slower |
| 20% | 0.37x | 63% slower |
Tips
- Start with a speed preset and adjust based on your typical pace
- The gradient distribution bar gives you a quick sense of how hilly the route is — a route with lots of orange (climbing) will take longer than a flat route at the same average speed
- For interval training routes, consider using a speed that reflects your average moving speed rather than overall speed
- You can apply Add Timing and then use Time Shift to adjust the start time later
- Compare the estimated duration against known times for similar routes to calibrate your speed setting