Elevation Check
The Elevation Check tool helps you verify the accuracy of elevation data in your GPX file, fix common GPS errors, and smooth noisy elevation readings.
Features
API Comparison
Compare your track's recorded elevation against real-world DEM data.
A DEM (Digital Elevation Model) is a map of ground-level elevation built from satellite or aerial surveys. It provides the true height of the terrain at any point, independent of GPS signal quality or barometric sensor drift. We use 1m-resolution LiDAR data for England and 30m satellite data elsewhere.
Sample Check tests 100 evenly-spaced points for a quick overview of accuracy. Check All Points fetches DEM elevation for every point in your track, giving a complete comparison with a progress bar.
When all points are checked:
- The chart shows both file elevation (blue) and DEM elevation (orange) as continuous lines — scroll to zoom in, letting you compare them in detail
- Elevation Gain Comparison shows file vs DEM ascent and descent totals, so you can see how much your device's noise affects the calculated climbing
Statistics shown: sample count, average difference, max difference, and RMSE.
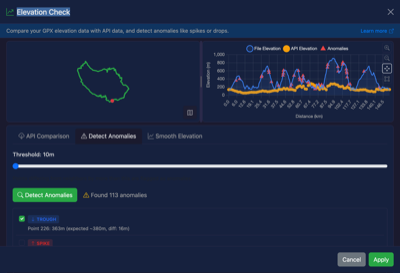
Anomaly Detection
Find elevation "spikes" and "troughs" that indicate GPS glitches or sensor errors.
How it works:
- For each point, the tool compares its elevation to the average of surrounding points
- If the difference exceeds your threshold (default 50m), it's flagged as an anomaly
- Spikes are points that are unusually high
- Troughs are points that are unusually low
Threshold setting:
- Lower values (10-30m) catch smaller anomalies but may flag legitimate terrain features
- Higher values (50-100m) only catch obvious GPS errors
- Adjust based on your terrain - mountainous routes may need higher thresholds
Fixing Anomalies
Once anomalies are detected, you can:
- Review each flagged point
- Select which anomalies to fix
- Click "Fix Selected" to smooth out the bad data
Fixed points are replaced with an interpolated value based on surrounding elevations.
Smooth Elevation
Apply a moving average filter to smooth out noisy elevation data. This is useful when your GPS device records jittery elevation values even without obvious spikes.
How it works:
- Uses a moving average algorithm to smooth elevation readings
- Each point's elevation is replaced with the average of surrounding points
- Adjustable window size (3-21 points) controls the smoothing intensity
Window size:
- Smaller windows (3-7) - Light smoothing, preserves more terrain detail
- Medium windows (9-13) - Balanced smoothing for typical GPS noise
- Larger windows (15-21) - Heavy smoothing for very noisy data
Preview:
- The chart shows the original elevation (blue) and smoothed preview (green)
- Displays statistics: original vs smoothed ascent/descent totals
- Review the preview before applying to ensure you're happy with the result
Best practices:
- Start with a smaller window and increase if needed
- Heavy smoothing will reduce calculated ascent/descent totals
- Smoothing is most effective for barometric altimeter noise
- Consider smoothing after fixing obvious anomalies
When to Use
- After importing from older GPS devices - These often have elevation drift
- Routes with sudden elevation spikes - Usually caused by GPS signal loss
- Noisy barometric data - When elevation fluctuates constantly
- Before sharing routes - Clean up any obvious errors
- Validating elevation-based statistics - Ensure ascent/descent calculations are accurate
Notes
- The elevation API requires an internet connection
- Sample Check tests 100 points; Check All Points tests every point (may take 10-30 seconds for large files)
- Anomaly detection and smoothing work entirely offline
- Scroll on the chart to zoom in/out for detailed comparison
- All changes can be undone using the undo feature