Gradient Report
The Gradient Report tool analyzes the gradients throughout your track and shows how much distance is spent at each gradient level.
What It Shows
Summary Statistics
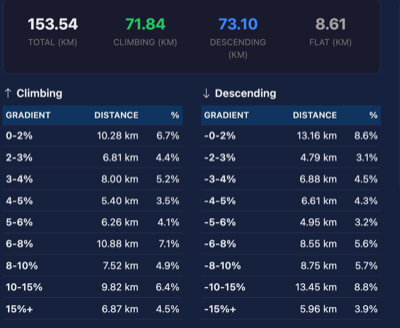
At the top, you'll see a quick overview:
- Total Distance - The complete track length
- Climbing Distance - Total distance spent going uphill (gradient > 0.5%)
- Descending Distance - Total distance spent going downhill (gradient < -0.5%)
- Flat Distance - Distance on relatively flat terrain (gradient between -0.5% and 0.5%)
Gradient Tables
The tool breaks down distance into gradient bands:
Climbing (Positive Gradients):
| Band | Description |
|---|---|
| 0-2% | Very gentle climb, barely noticeable |
| 2-3% | Gentle climb, sustainable for long periods |
| 3-4% | Moderate climb, noticeable effort required |
| 4-5% | Challenging climb for most riders |
| 5-6% | Hard climb, significant effort |
| 6-8% | Very hard climb |
| 8-10% | Steep climb |
| 10-15% | Very steep climb |
| 15%+ | Extremely steep, may require walking |
Bar Chart
A visual representation shows the distribution of distance across all gradient bands, with:
- Green bars for climbing gradients
- Blue bars for descending gradients
- Gray bar for flat sections
Understanding Gradients
Gradient (or grade) is expressed as a percentage representing the elevation change per horizontal distance:
- 5% gradient = 5 meters of rise for every 100 meters of horizontal distance
- 10% gradient = 10 meters of rise for every 100 meters
When to Use
- Route planning - Understand the difficulty of a planned route
- Training analysis - See how much climbing practice a route provides
- Comparing routes - Objectively compare the steepness of different rides
- Identifying steep sections - Find where the hardest climbs are located
Notes
- This is an analysis-only tool - it doesn't modify your track data
- Very short segments (under 0.5m) are excluded to reduce GPS noise effects
- Gradient is calculated between consecutive track points