Multi-Loop Planner
The Multi-Loop Planner helps you plan multi-loop endurance events by assembling routes into a sequence with breaks, timing, and optional scoring. Ideal for 12-hour, 24-hour, and multi-day cycling, running, or hiking events.
Overview
Build an event plan by:
- Adding route files to your Route Library (up to 5 routes)
- Assembling a sequence of loops in the Plan Builder
- Setting break times between loops
- Configuring event start time and duration
- Exporting your plan as Markdown or a printable report
Route Library
The Route Library stores your available routes. When you open the tool, your currently loaded file is automatically added as the first route.
- Add Route: Click to upload additional GPX or FIT files (max 5 total)
- Edit Name: Click the name field to rename a route (e.g., "North Loop", "Hill Circuit")
- Remove: Delete a route and all plan slots that reference it
- Color: Each route gets a unique color used throughout the tool
Each route displays its total distance, elevation gain, and duration. Routes without timestamp data show a warning icon and "--" for duration.
Average Speed Estimate
Each route has an optional km/h speed input. When you enter an average speed, the tool calculates a gradient-adjusted time estimate for that route instead of relying on file timestamps. This is useful for:
- Route/course files that have no timestamp data
- Planning at a different pace than the original recording
- Estimating times for routes you haven't ridden or run yet
Estimated durations are marked with a calculator icon to distinguish them from recorded times. Leave the speed field empty (or 0) to use the original file timing data.
The speed model adjusts for gradient using a cycling-based formula: speed decreases exponentially on climbs and increases moderately on descents (capped at 1.4x flat speed). Gradients are clamped at +/-30% to avoid GPS noise artifacts.
Event Settings
| Setting | Description |
|---|---|
| Start Time | Set the event start date and time. When set, the detail table shows clock times for each loop start and end. |
| Duration | Event duration in hours (e.g., 24 for a 24-hour event). Shows remaining time in the stats bar, turning red if your plan exceeds the limit. |
| Enable Scoring | Adds score inputs to routes and cumulative score tracking. Useful for events where different loops earn different points. |
Plan Builder
Build your event sequence by clicking route buttons to add loops:
- Add Loop: Click any route button to append it to the plan
- Drag Reorder: Drag loops to change their order
- Duplicate: Copy a loop (inserted after the original)
- Break Time: Set minutes of rest after each loop
- Remove: Delete a loop from the plan
The same route can appear multiple times in a plan. Colors are per-route, so all instances of the same route share the same color.
Cumulative Stats Bar
The stats bar updates live as you build your plan, showing:
- Loops: Total number of loops
- Total Distance: Sum of all loop distances
- Total Elevation: Sum of all ascent
- Total Time: Total riding/running time plus breaks
- Total Score: Sum of scores (when scoring is enabled)
- Remaining: Time left in the event (when duration is set)
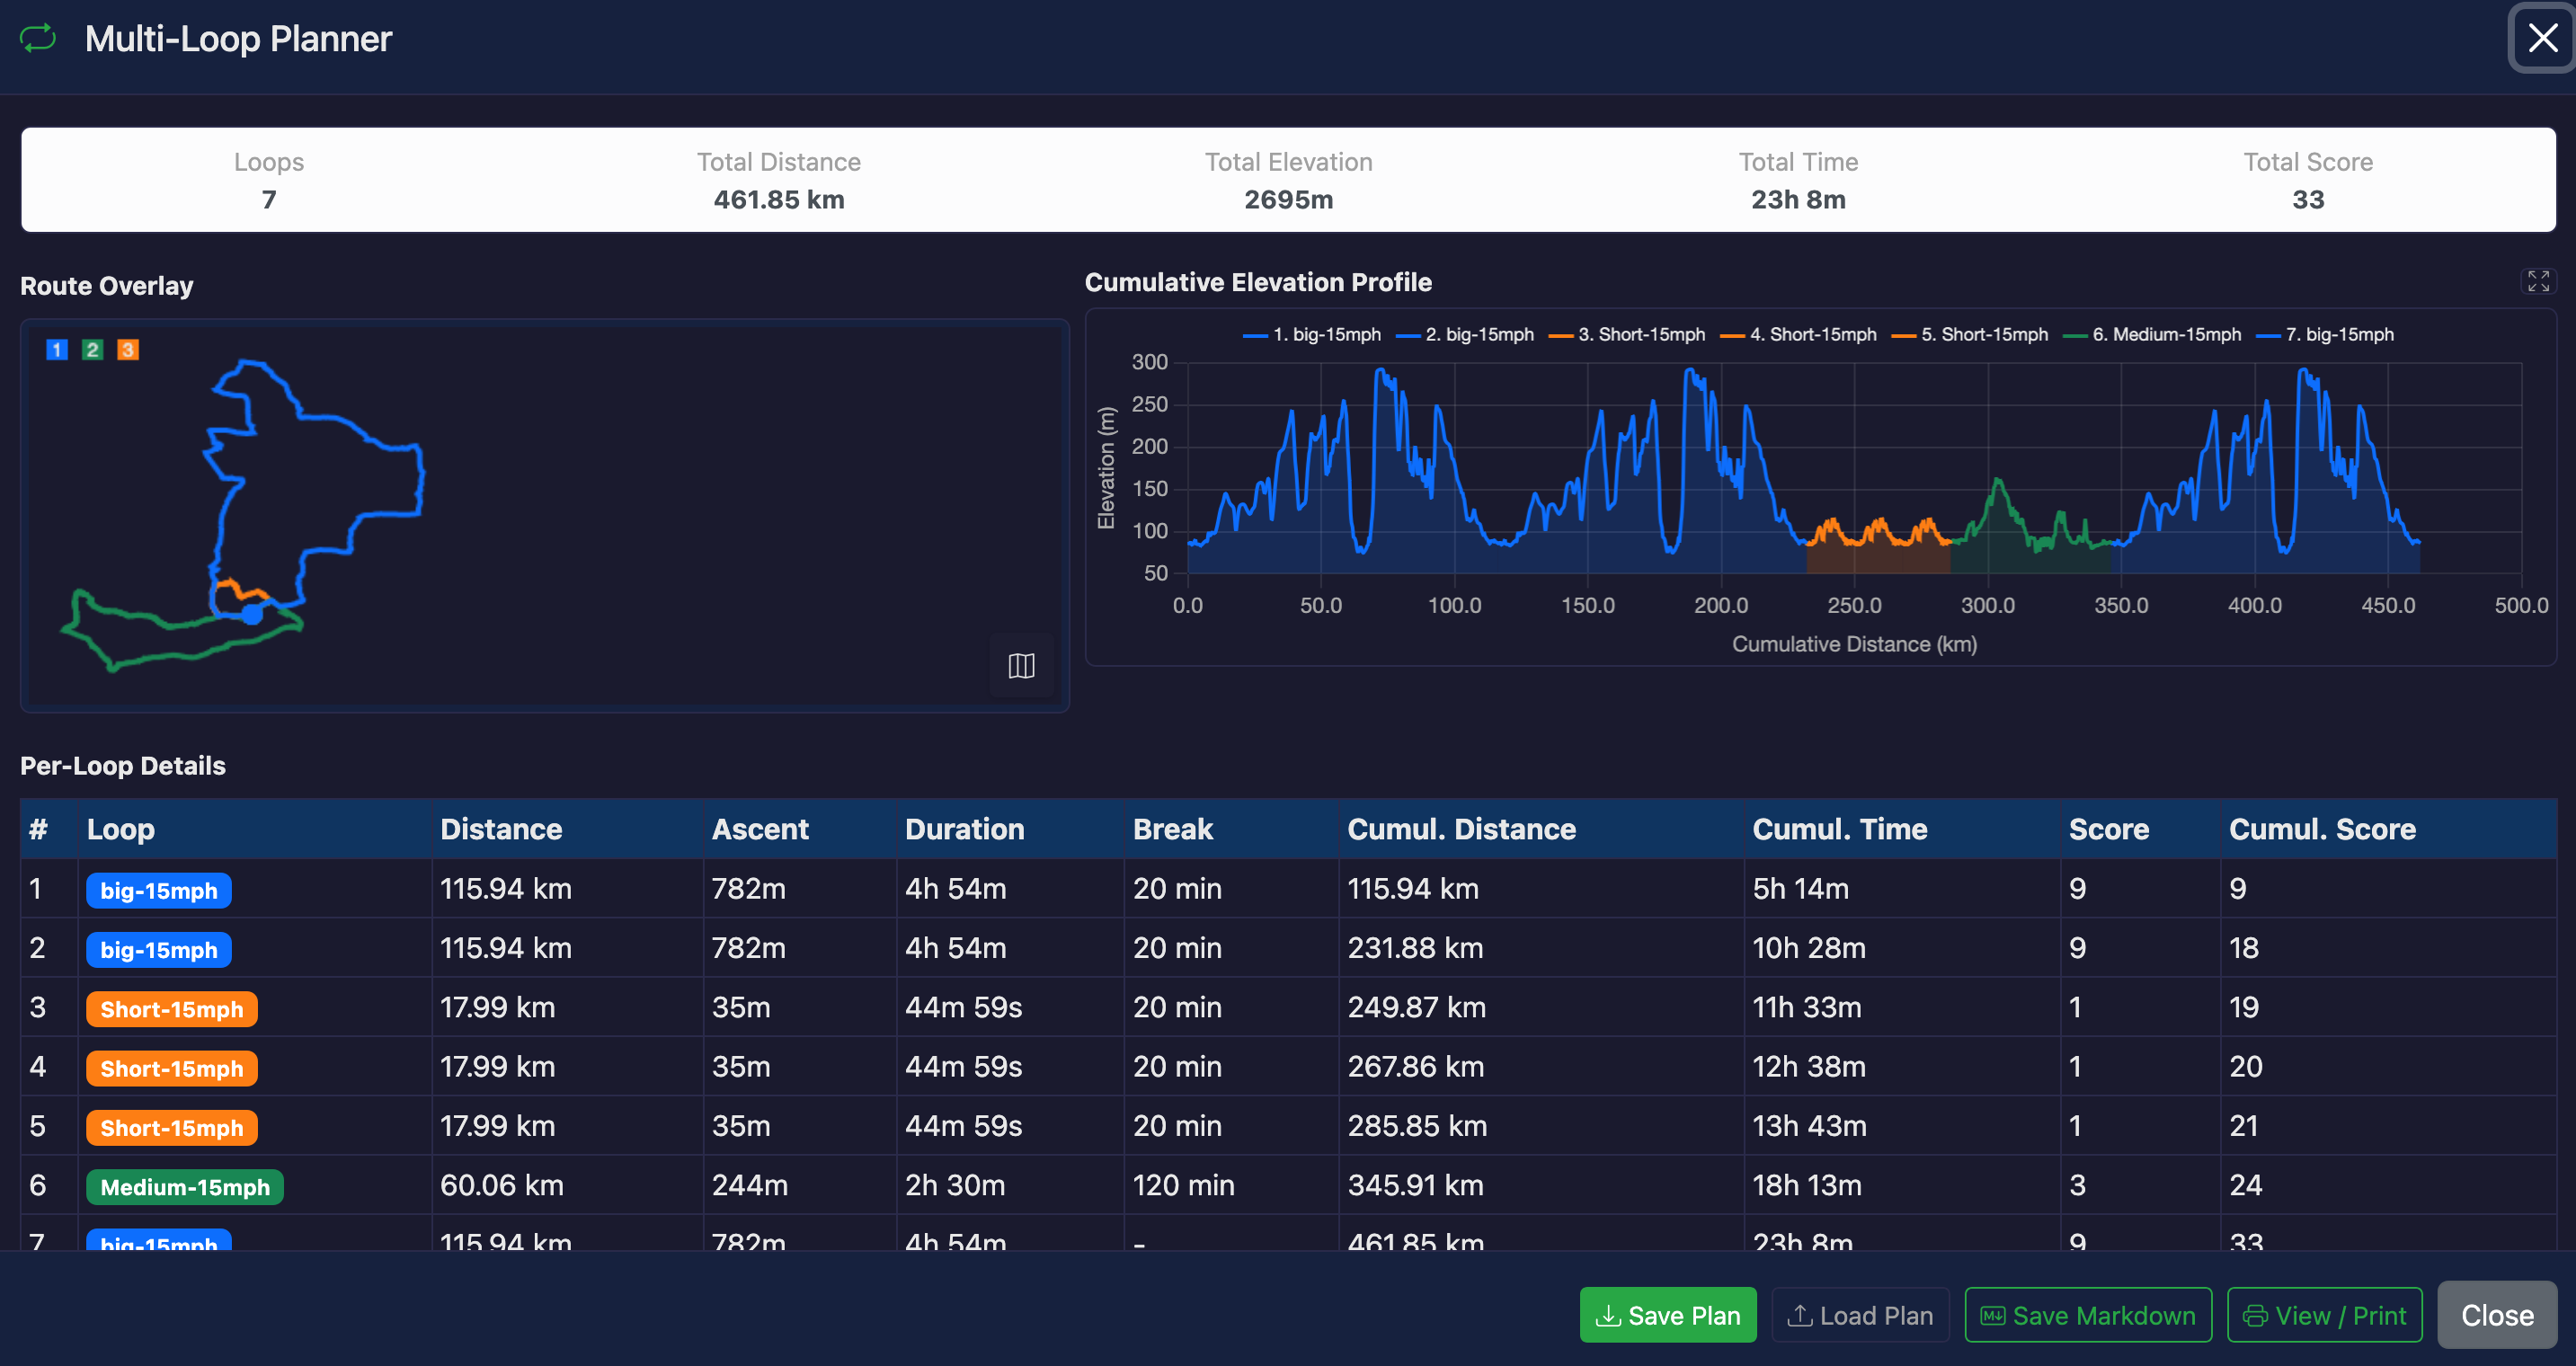
Per-Loop Detail Table
A detailed table shows each loop with:
| Column | Description |
|---|---|
| # | Loop number |
| Loop | Route name with color badge |
| Distance | Distance for this loop |
| Ascent | Elevation gain for this loop |
| Duration | Time for this loop (from route timing data or speed estimate) |
| Break | Rest time after this loop |
| Cumul. Distance | Running total distance |
| Cumul. Time | Running total time including breaks |
| Start At / End At | Clock times (shown when start time is set). For multi-day events, a day offset is shown (e.g., "14:30 (+1d)") |
| Score / Cumul. Score | Points for this loop and running total (shown when scoring is enabled) |
Visualization
Route Overlay
Shows all routes from the library overlaid on a canvas preview or interactive Leaflet map. Toggle between views with the map button. Each route is drawn in its assigned color with start (hollow) and end (filled) markers.Cumulative Elevation Profile
The elevation chart shows the profile for your entire plan sequence. Each loop segment is colored by its route, and the X-axis shows cumulative distance across all loops. Use the fullscreen button to expand the chart.Export Options
Save / Load Plan
Save your plan as a compressed.zip file containing all route data and settings. Load a previously saved plan to restore routes, sequence, breaks, and speed estimates. Save Markdown
Downloads a.md file containing your complete plan in Markdown table format, including route library, plan sequence, and summary statistics. Great for sharing in forums, wikis, or race briefings. View / Print
Opens a clean, print-friendly report in a new browser tab. Includes route cards, the full plan table, summary statistics, and snapshots of the map and elevation chart. Use your browser's print function (or "Save as PDF") to create a PDF.Timing Data
Loop durations come from one of two sources:
- File timestamps (default): Actual trackpoint timestamps from your recorded activity. This reflects real-world conditions.
- Speed estimate: When you enter an average speed (km/h) for a route, the tool calculates a gradient-adjusted duration. Estimated times are shown with a calculator icon.
If a route has neither timestamps nor a speed estimate, it shows "--" for duration and time-based calculations are unavailable. A warning badge appears next to such routes.
You can mix both sources in the same plan: some routes using recorded times and others using speed estimates. All time-based features (cumulative stats, clock times, remaining time) work with either source.
Multi-Day Events
The planner fully supports multi-day events:
- Set any duration (e.g., 48 hours for a 2-day event)
- Clock times automatically roll past midnight with day indicators (e.g., "02:30 (+1d)", "18:00 (+2d)")
- Duration formatting handles values above 24 hours (e.g., "36h 15m")
Example Use Cases
- 24-Hour Cycling Event: Plan which loops to ride and when, estimate total distance and check if you'll finish in time
- Ultra-Running Event: Assemble loops of different lengths and terrain, plan break times at aid stations
- Scored Endurance Event: Different loops earn different points; optimize your route selection to maximize score within the time limit
- Training Plan: Plan a back-to-back loop session with rest intervals
- Event Briefing: Export a printable plan to share with your support crew
Tips
- Start by loading your most frequently used loop, then add alternates with "Add Route"
- Use the Duplicate button to quickly repeat the same loop multiple times
- Set realistic break times to get accurate finish time estimates
- Routes with actual timing data give the most accurate time predictions
- For course files without timestamps, enter an average speed (km/h) to get gradient-adjusted time estimates
- Use "View / Print" to create a PDF plan sheet to take to the event