Overpass Status Monitor
Monitor the health and performance of Overpass API servers in real-time.
If you find this tool useful, please consider buying me a coffee!
Overview
Overpass API Status Monitor is a client-side tool for monitoring Overpass API servers. It tracks server health, query performance, and data freshness without requiring any backend.
All data is stored in your browser's localStorage and persists across page reloads.
Adding Servers
The site operator may have pre-configured default servers. These will appear automatically on your first visit. You can add more servers or remove the defaults as needed.
Click Add Server to add servers to monitor. You can:
- Select from preset public servers (Main, Z, LZ4, Coffee, Japan, Swiss)
- Add a custom server by entering its URL
- Add all preset servers at once
Server URLs should point to the Overpass API endpoint (e.g., https://overpass-api.de).
Layouts
Card View
Detailed view showing all metrics for each server in a card format. Best for monitoring a small number of servers.
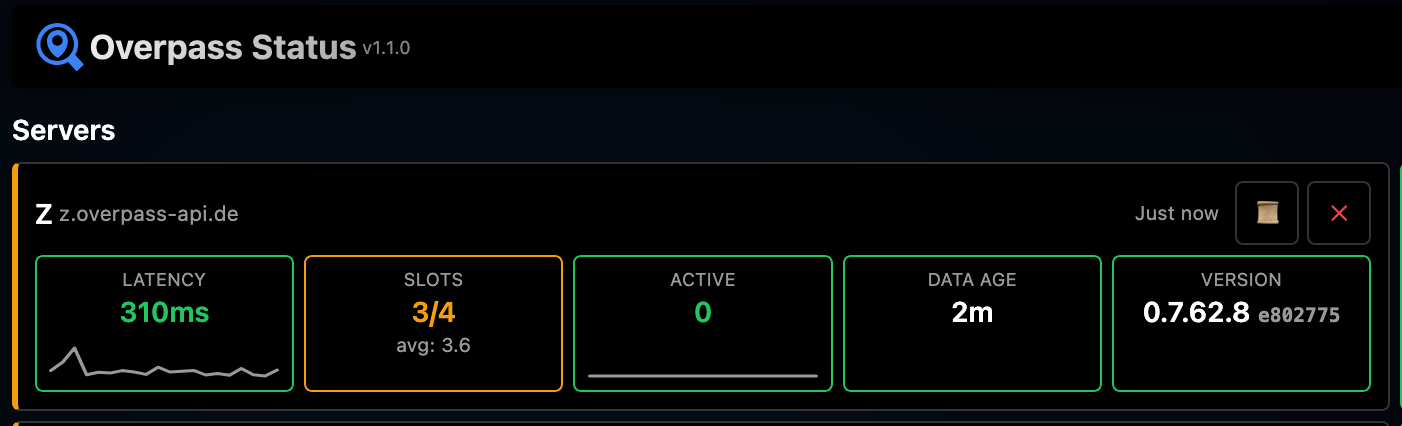
Table View
Compact view with servers in rows. Hides the header, landmarks section, and API log for focused monitoring. Best for many servers.
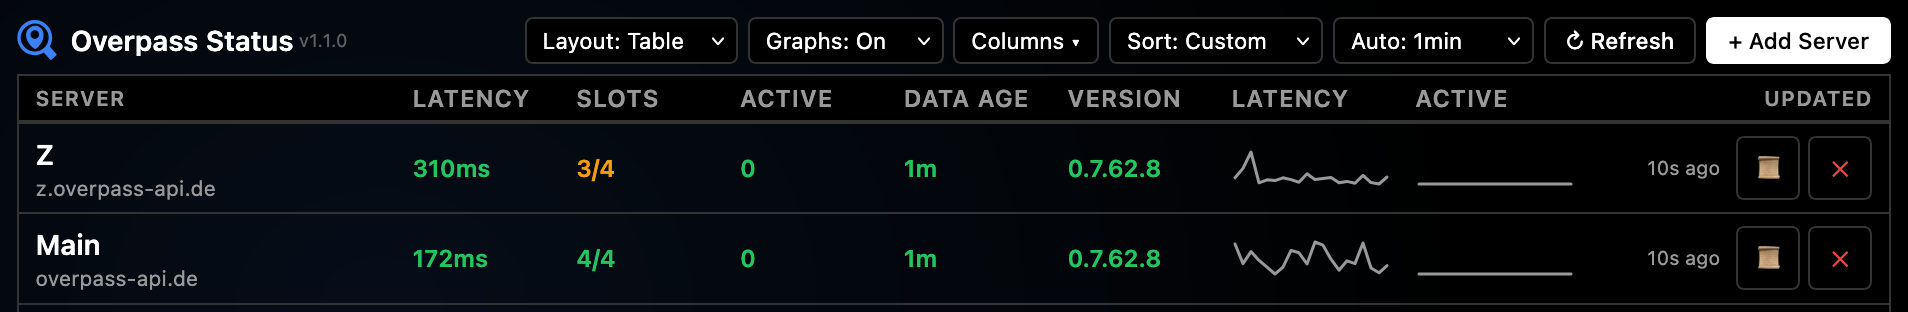
Use the Columns dropdown to show/hide specific metrics.
Latency
Round-trip time to fetch the server's status endpoint (/api/status). Measured in milliseconds.
| Status | Threshold |
|---|---|
| Green | < 500ms |
| Orange | 500ms - 1000ms |
| Red | > 1000ms |
Query Slots
Available query slots on the server. Each Overpass query uses one slot. When all slots are in use, new queries are queued.
| Status | Condition |
|---|---|
| Green | Slots available |
| Orange | 1-2 slots remaining |
| Red | No slots available |
Active Queries
Number of queries currently running on the server. High numbers indicate heavy server load.
| Status | Threshold |
|---|---|
| Green | < 5 queries |
| Orange | 5 - 10 queries |
| Red | > 10 queries |
Data Age
How old the OpenStreetMap data is on the server. Based on the timestamp_osm_base value from the status endpoint.
| Status | Threshold |
|---|---|
| Green | < 30 minutes |
| Orange | 30 min - 24 hours |
| Red | > 24 hours |
Version
The Overpass API software version running on the server (e.g., 0.7.62).
| Status | Condition |
|---|---|
| Green | Latest version among monitored servers |
| Orange | Behind latest version |
Card view also shows the short git commit hash (e.g., e83c1b4) from the Overpass API source code repository. This identifies the exact build and can differ between servers running the same version number. The time since last version upgrade is also displayed when detected.
Color Coding
Each metric uses color to indicate status:
- Green — Healthy, no issues
- Orange — Warning, monitor closely
- Red — Issue detected, may affect queries
In card view, the left border color reflects the worst status among all metrics.
Sparkline Graphs
Enable graphs via Graphs: On dropdown. Sparklines appear for:
- Latency history
- Query slots history
- Active queries history
- Data age history
Hover over any graph to see a larger popup with:
- Y-axis scale (ms/seconds for latency, count for others, adaptive units for data age)
- X-axis timestamps (oldest to newest)
History stores the last 100 data points per server. Sparklines display the most recent 20 points. Data persists across page reloads.
Load Balancing Detection
Some Overpass servers use load balancing with multiple backend servers. The monitor detects this by tracking the "Announced endpoint" from each status response.
When a different backend is detected:
- The current endpoint appears after the server URL (e.g.,
→ gall) - A warning icon ⚠ appears when multiple backends are detected
- Click the endpoint to see all detected backends
- Add individual backends as separate servers for more consistent monitoring
- DNS-based balancing — The domain resolves to multiple IP addresses. Each request may hit a different server, but they all appear as the same URL.
- Reverse proxy — A load balancer sits in front of backend servers but doesn't pass through their identity.
HTTP Cache Detection
Some Overpass servers have HTTP caching (e.g., nginx proxy cache) in front of them. This can cause the Data Age metric to appear stuck or stale, even when the actual Overpass data is fresh.
The problem
When an HTTP cache sits in front of an Overpass server, repeated queries for the same data return cached responses. Since the monitor normally queries node(1) to check server metadata, a cache may return the same timestamp_osm_base value for hours or even days — making the data appear stale when the actual Overpass database is freshly updated.
How we detect it
The monitor uses a two-step detection process:
- Track consecutive timestamps: After each refresh, the monitor compares the new
timestamp_osm_basewith the previous value. If the same timestamp appears twice in a row, it triggers a cache test. - Cache-bust test: The monitor sends a second query using a random node ID (e.g.,
node(1847293)instead ofnode(1)). Since this query hasn't been cached, it bypasses the HTTP cache and returns the real timestamp. - Compare results: If the cache-bust query returns a fresher timestamp than the normal query, HTTP caching is confirmed.
Example from testing
Here's what we observed when testing a server with nginx proxy caching enabled:
| Step | Query | Result |
|---|---|---|
| 1. Normal query | [out:json];node(1);out meta; | timestamp_osm_base: 2026-01-14T07:26:15Z |
| 2. Refresh (3 min later) | [out:json];node(1);out meta; | timestamp_osm_base: 2026-01-14T07:26:15Z (same!) |
| 3. Cache-bust test | [out:json];node(1019429);out meta; | timestamp_osm_base: 2026-01-14T07:27:11Z (fresher) |
The normal query returned the same timestamp twice because it hit the HTTP cache. The random node ID query bypassed the cache and revealed the actual data age — nearly a minute fresher.
What cached responses look like
Signs that a server may have HTTP caching:
- Stuck data age: The timestamp doesn't change across multiple refreshes, even though other servers show updates
- Misleading staleness: Data age shows hours or days old when the server should have fresh data
- Sudden jumps: After cache expiry, the data age suddenly jumps to a much fresher value
Cache indicator
When HTTP caching is detected on a server:
- A C badge appears next to the server name
- Click the badge to see cache status and toggle cache-busting
- When cache-busting is enabled, the badge turns C green
Cache-busting
When you enable cache-busting for a server, the monitor uses randomized query node IDs instead of the standard node(1). This bypasses the HTTP cache and returns fresh timestamp_osm_base values.
config.json by adding "cacheBusting": true to the server entry. See Server Config File for details.Landmark Tests
Test server response by querying for famous landmarks around the world:
- Eiffel Tower (Paris)
- Statue of Liberty (New York)
- Sydney Opera House
- Christ the Redeemer (Rio)
- Table Mountain (Cape Town)
- Tokyo Tower
- Taj Mahal (Agra)
- Big Ben (London)
- Great Wall (Beijing)
- Burj Khalifa (Dubai)
Click Run Tests to query all servers, or click a landmark card to test just that location.
Custom Ordering
In card view, drag and drop server cards to reorder them. Your custom order is saved and persists across reloads.
Use the Sort dropdown to sort by:
- Custom — Your drag-and-drop order
- Name — Alphabetical
- Latency — Fastest first
- Version — Newest version first
Sharing Configuration
In the About modal, copy your configuration URL to share your setup with others. The URL includes:
- Server list
- Layout preference
- Sort order
- Refresh interval
- Graph visibility
- Theme
Export/Import
In the About modal:
- Export Config — Download a JSON file with your complete configuration including history data
- Import Config — Load a previously exported configuration file
Auto-Refresh
The monitor can automatically refresh server status at regular intervals. Use the Refresh dropdown to select an interval:
- Off — Manual refresh only
- 1 min — Every 60 seconds
- 2 min — Every 2 minutes
- 3 min — Every 3 minutes (default, recommended)
- 5 min — Every 5 minutes
- 10 min — Every 10 minutes
- 30 min — Every 30 minutes
- 1 hr — Every hour
API Log
The collapsible API Log panel at the bottom of the page shows all requests made to Overpass servers. Click the header to expand or collapse it.
Each log entry shows:
- Timestamp — When the request was made
- Method — HTTP method (GET for status checks, POST for queries)
- URL — Server endpoint and request type
- Status — HTTP response code
- Latency — Response time in milliseconds
Click any log entry to view the full request and response details. Use the Clear button to reset the log. You can also filter logs by clicking the log icon on a specific server card.
URL Parameters
Configure the monitor via URL query parameters:
| Parameter | Values | Example |
|---|---|---|
servers | Comma-separated names or URLs | ?servers=Main,Z,Coffee |
layout | card, table | ?layout=table |
sort | custom, name, latency, version | ?sort=latency |
refresh | Seconds: 0, 60, 120, 180, 300, 600, 1800, 3600 | ?refresh=300 |
graphs | on, off | ?graphs=on |
theme | light, dark | ?theme=dark |
Example URLs
?servers=Main,Z,LZ4— Monitor the three main overpass-api.de servers?servers=Main&layout=table&refresh=60— Single server in compact table view, refreshing every minute?servers=Main,Coffee,Japan&graphs=on&theme=dark— Three servers with graphs enabled in dark mode?servers=Main,Z&sort=latency&graphs=on— Two servers sorted by fastest response, with graphs
Preset Servers
| Name | URL | Description |
|---|---|---|
| Main | overpass-api.de | Primary public instance |
| Z | z.overpass-api.de | Alternative endpoint |
| LZ4 | lz4.overpass-api.de | Compressed responses |
| Coffee | overpass.private.coffee | Community instance |
| Japan | overpass.osm.jp | Japan-based instance |
| Swiss | overpass.osm.ch | Switzerland-based instance |
Server Config File
If you host your own instance of Overpass Status, you can configure defaults by creating a config.json file in the same directory as index.html.
Options
| Option | Description |
|---|---|
servers | Array of default servers for new visitors |
servers[].name | Display name for the server |
servers[].url | URL of the Overpass server |
servers[].cacheBusting | Set to true if the server has HTTP caching (e.g., nginx proxy). Enables cache-busting queries automatically. |
minRefresh | Minimum refresh interval in seconds (restricts dropdown options) |
allowCustomServers | Set to false to prevent users from adding their own servers |
showHelp | Set to false to hide the help link |
showAbout | Set to false to hide the about button |
allowCustomServers, showHelp, and showAbout all to false. This hides all navigation and editing options, showing only the server status.Example
{
  "servers": [
    { "name": "My Server", "url": "https://overpass.example.com" },
    { "name": "Cached Server", "url": "https://overpass2.example.com", "cacheBusting": true }
  ],
  "minRefresh": 180,
  "allowCustomServers": false,
  "showHelp": false,
  "showAbout": false
}
Copy config.example.json to config.json and edit as needed.
minRefresh and allowCustomServers settings always apply to all users.View the source code on GitHub.
If you find this tool useful, consider buying me a coffee ☕